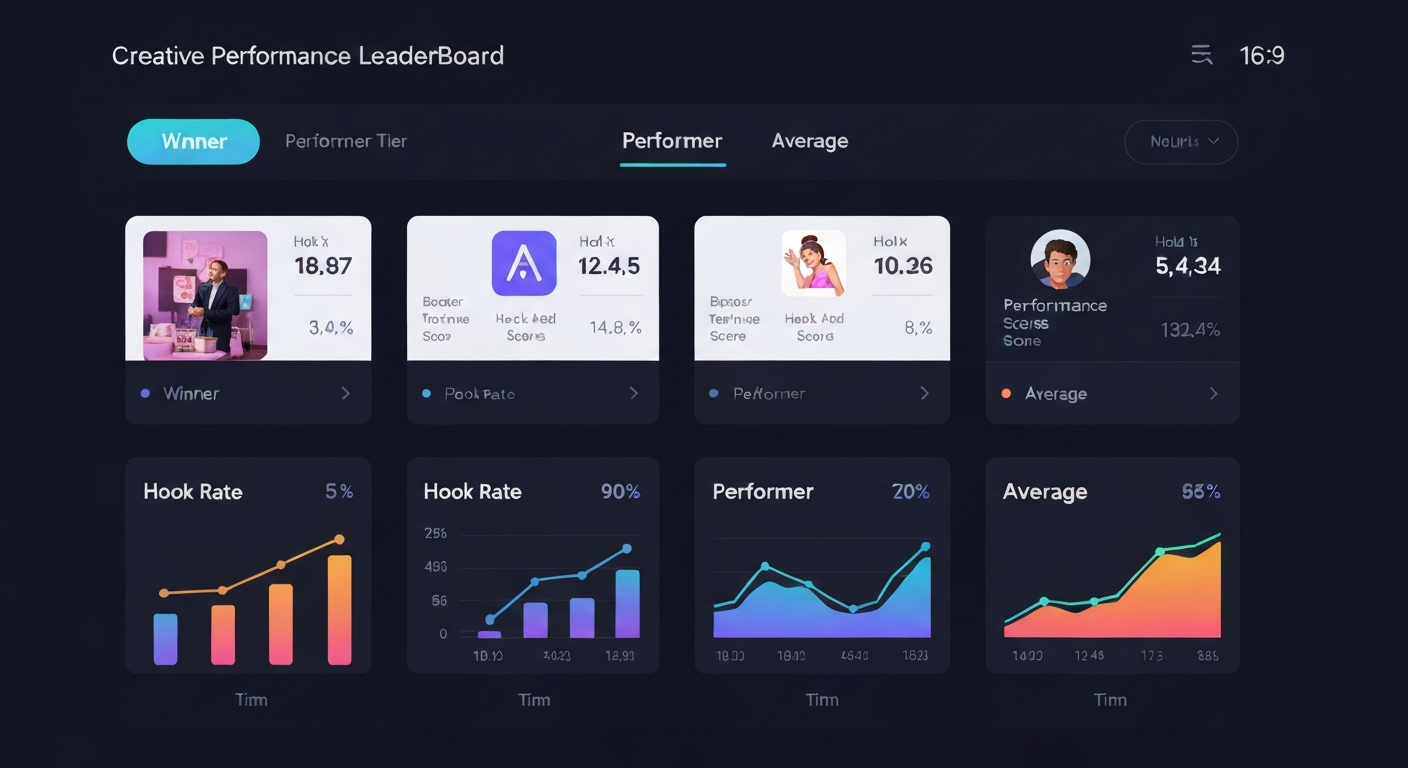



Project Overview:
- Project: Creative Performance Tracker
- Platform: n8n (self-hosted workflow automation)
- AI Model: OpenAI GPT-4o-mini
- Objective: Automatically pull ad creative performance data from Meta Ads API, score each creative with AI analysis (0–100), classify winners and losers, and build a historical database with actionable recommendations — delivered every 6 hours via Slack.
Background:
Performance marketing teams run dozens of creatives simultaneously, but identifying which ones are actually working requires hours of manual spreadsheet analysis. By the time someone notices a creative is underperforming, budget has already been wasted. This automation flips the script: every 6 hours, it pulls fresh data from Meta Ads, calculates video-specific metrics (hook rate, hold rate, completion rate), runs each creative through AI analysis, and delivers a clear report — winners to scale, losers to kill, and specific recommendations for everything in between.
How It Works:
Meta Ads Data Collection & Metric Calculation:
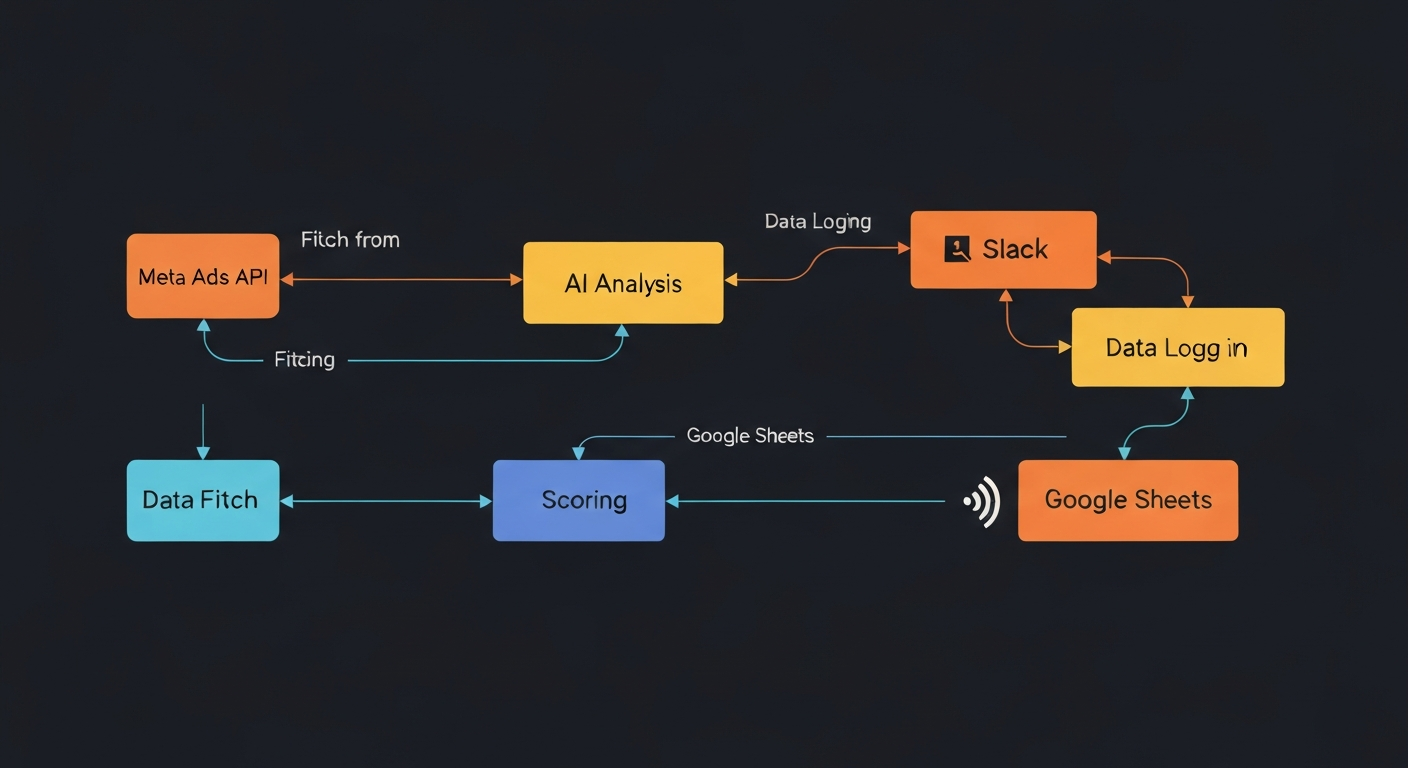
Every 6 hours, the workflow queries the Meta Ads API for all active and paused ads with full insights from the last 7 days. It then calculates video-specific metrics that Meta does not surface natively: hook rate (what percentage of impressions watched 3+ seconds), hold rate (of those who watched 3s, how many made it to 50%), and completion rate (of 3s viewers, how many finished). These metrics reveal exactly where viewers are dropping off.
AI-Powered Creative Scoring:
Each creative is sent to GPT-4o-mini with its full performance profile. The AI scores it 0–100, classifies it into a tier (winner, performer, average, underperformer, loser), identifies specific strengths and weaknesses, generates actionable recommendations, and assigns a scale action: scale up, maintain, iterate, pause, or kill. The scoring considers hook rate, hold rate, CTR, cost efficiency, and ROAS together.
Database Logging & Team Reporting:
All metrics and AI analysis are appended to a Google Sheet — building a historical creative performance database over time. A summary report is generated aggregating all creatives: total count, average score, total spend, top winners, and underperformers flagged for immediate action. This report is posted to Slack so the team always knows which creatives to scale and which to cut.
Key Results:
- Automated analysis: Every creative scored and classified every 6 hours, zero manual work
- Video-specific metrics: Hook rate, hold rate, and completion rate calculated automatically
- AI scoring: 0–100 score with tier classification and specific improvement recommendations
- Historical tracking: Google Sheets database builds a creative performance archive over time
Tech Stack:
- n8n (workflow automation)
- Meta Ads API (performance data)
- OpenAI GPT-4o-mini (creative analysis & scoring)
- Google Sheets API (historical database)
- Slack API (team reporting)